Index Trend Analysis Report
Prepared for you on Sunday, March 22, 2026.
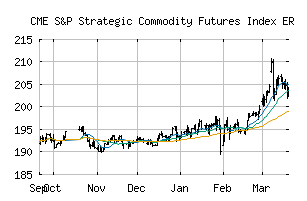
S&P Strategic Commodity Futures Index ER (CME:SPSCFIP)
Countertrend Up (+85) - SPSCFIP is showing short-term weakness. However, look for the longer-term bullish trend to resume. As always, continue to monitor the trend score and utilize a stop order.
Is it time to buy, sell, or avoid SPSCFIP?
MarketClub looks at technical strength and momentum to determine if the timing is right for SPSCFIP.
Learn more about the Trade Triangles and how we make technical analysis as easy as buy and sell.
|
|||||||||||||||
|
|||||||||||||||
MarketClub’s Trade Triangles for SPSCFIP
![]() The long-term trend has been UP since Feb 19th, 2026 at 197.94
The long-term trend has been UP since Feb 19th, 2026 at 197.94
![]() The intermediate-term trend has been UP since Feb 19th, 2026 at 197.94
The intermediate-term trend has been UP since Feb 19th, 2026 at 197.94
![]() The short-term trend has been DOWN since Mar 16th, 2026 at 204.70
The short-term trend has been DOWN since Mar 16th, 2026 at 204.70
Smart Scan Analysis for SPSCFIP
Based on our trend formula, SPSCFIP is rated as a +85 on a scale from -100 (Strong Downtrend) to +100 (Strong Uptrend).
| Open | High | Low | Price | Change |
|---|---|---|---|---|
| 202.52 | 204.38 | 202.23 | 203.84 | +1.20 |
| Prev. Close | Volume | Bid | Ask | Time |
| 203.84 | 0 | 2026-03-20 15:35:45 |