Index Trend Analysis Report
Prepared for you on Saturday, January 17, 2026.
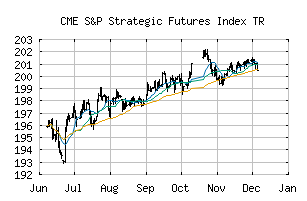
S&P Strategic Futures Index TR (CME:SPSFIT)
Strong Uptrend (+100) - SPSFIT is in a strong uptrend that is likely to continue. With short-term, intermediate, and long-term bullish momentum, SPSFIT continues to climb. Traders should protect gains and look for a change in score to suggest a slow down in momentum.
Is it time to buy, sell, or avoid SPSFIT?
MarketClub looks at technical strength and momentum to determine if the timing is right for SPSFIT.
Learn more about the Trade Triangles and how we make technical analysis as easy as buy and sell.
|
|||||||||||||||
|
|||||||||||||||
MarketClub’s Trade Triangles for SPSFIT
![]() The long-term trend has been UP since Jun 9th, 2025 at 196.29
The long-term trend has been UP since Jun 9th, 2025 at 196.29
![]() The intermediate-term trend has been UP since Dec 18th, 2025 at 201.56
The intermediate-term trend has been UP since Dec 18th, 2025 at 201.56
![]() The short-term trend has been UP since Jan 11th, 2026 at 201.99
The short-term trend has been UP since Jan 11th, 2026 at 201.99
Smart Scan Analysis for SPSFIT
Based on our trend formula, SPSFIT is rated as a +100 on a scale from -100 (Strong Downtrend) to +100 (Strong Uptrend).
| Open | High | Low | Price | Change |
|---|---|---|---|---|
| 202.62 | 202.68 | 201.86 | 202.18 | -0.44 |
| Prev. Close | Volume | Bid | Ask | Time |
| 202.18 | 0 | 2026-01-16 15:42:07 |