Index Trend Analysis Report
Prepared for you on Friday, April 19, 2024.
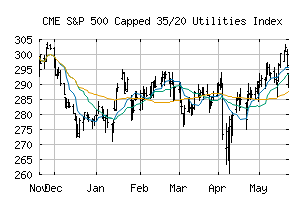
S&P 500 Capped 35/20 Utilities Index (CME:SPSVULP)
Crossroads (-60) - SPSVULP is struggling to move into a solid trend. Beware of choppy markets and consider a sidelines position until a stronger trend is identified.
Is it time to buy, sell, or avoid SPSVULP?
MarketClub looks at technical strength and momentum to determine if the timing is right for SPSVULP.
Learn more about the Trade Triangles and how we make technical analysis as easy as buy and sell.
|
|||||||||||||||
|
|||||||||||||||
MarketClub’s Trade Triangles for SPSVULP
![]() The long-term trend has been UP since Apr 4th, 2024 at 240.83
The long-term trend has been UP since Apr 4th, 2024 at 240.83
![]() The intermediate-term trend has been DOWN since Apr 15th, 2024 at 232.22
The intermediate-term trend has been DOWN since Apr 15th, 2024 at 232.22
![]() The short-term trend has been DOWN since Apr 12th, 2024 at 235.37
The short-term trend has been DOWN since Apr 12th, 2024 at 235.37
Smart Scan Analysis for SPSVULP
Based on our trend formula, SPSVULP is rated as a -60 on a scale from -100 (Strong Downtrend) to +100 (Strong Uptrend).
| Open | High | Low | Price | Change |
|---|---|---|---|---|
| 235.45 | 236.82 | 233.79 | 236.12 | +1.44 |
| Prev. Close | Volume | Bid | Ask | Time |
| 236.12 | 0 | 2024-04-18 16:19:52 |