Index Trend Analysis Report
Prepared for you on Wednesday, April 24, 2024.
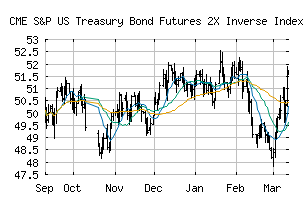
S&P US Treasury Bond Futures 2X Inverse Index ER (CME:SPUST2IP)
Long-Term Uptrend (+90) - SPUST2IP is in a strong uptrend that is likely to continue. While SPUST2IP is showing intraday weakness, it remains in the confines of a bullish trend. Traders should use caution and utilize a stop order.
Is it time to buy, sell, or avoid SPUST2IP?
MarketClub looks at technical strength and momentum to determine if the timing is right for SPUST2IP.
Learn more about the Trade Triangles and how we make technical analysis as easy as buy and sell.
|
|||||||||||||||
|
|||||||||||||||
MarketClub’s Trade Triangles for SPUST2IP
![]() The long-term trend has been UP since Apr 2nd, 2024 at 53.169
The long-term trend has been UP since Apr 2nd, 2024 at 53.169
![]() The intermediate-term trend has been UP since Mar 18th, 2024 at 52.480
The intermediate-term trend has been UP since Mar 18th, 2024 at 52.480
![]() The short-term trend has been UP since Apr 22nd, 2024 at 56.024
The short-term trend has been UP since Apr 22nd, 2024 at 56.024
Smart Scan Analysis for SPUST2IP
Based on our trend formula, SPUST2IP is rated as a +90 on a scale from -100 (Strong Downtrend) to +100 (Strong Uptrend).
| Open | High | Low | Price | Change |
|---|---|---|---|---|
| 55.623 | 56.438 | 55.563 | 56.166 | +0.573 |
| Prev. Close | Volume | Bid | Ask | Time |
| 55.593 | 0 | 2024-04-24 12:22:03 |