Index Trend Analysis Report
Prepared for you on Thursday, July 31, 2025.
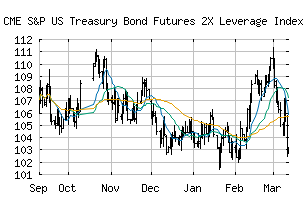
S&P US Treasury Bond Futures 2X Leverage Index ER (CME:SPUST2LP)
Bull Market Weakness (+75) - SPUST2LP is showing signs of short-term weakness, but still remains in the confines of a long-term uptrend. Keep an eye on SPUST2LP as it may be in the beginning stages of a reversal.
Is it time to buy, sell, or avoid SPUST2LP?
MarketClub looks at technical strength and momentum to determine if the timing is right for SPUST2LP.
Learn more about the Trade Triangles and how we make technical analysis as easy as buy and sell.
|
|||||||||||||||
|
|||||||||||||||
MarketClub’s Trade Triangles for SPUST2LP
![]() The long-term trend has been DOWN since May 19th, 2025 at 95.834
The long-term trend has been DOWN since May 19th, 2025 at 95.834
![]() The intermediate-term trend has been UP since Jul 29th, 2025 at 101.339
The intermediate-term trend has been UP since Jul 29th, 2025 at 101.339
![]() The short-term trend has been UP since Jul 21st, 2025 at 98.225
The short-term trend has been UP since Jul 21st, 2025 at 98.225
Smart Scan Analysis for SPUST2LP
Based on our trend formula, SPUST2LP is rated as a +70 on a scale from -100 (Strong Downtrend) to +100 (Strong Uptrend).
| Open | High | Low | Price | Change |
|---|---|---|---|---|
| 100.990 | 101.376 | 100.935 | 101.211 | +0.276 |
| Prev. Close | Volume | Bid | Ask | Time |
| 100.935 | 0 | 2025-07-31 02:38:08 |