Index Trend Analysis Report
Prepared for you on Friday, March 13, 2026.
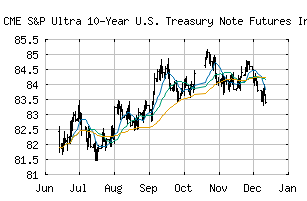
S&P Ultra 10-Year U.S. Treasury Note Futures Index (CME:SPUSTN)
Crossroads (-60) - SPUSTN is struggling to move into a solid trend. Beware of choppy markets and consider a sidelines position until a stronger trend is identified.
Is it time to buy, sell, or avoid SPUSTN?
MarketClub looks at technical strength and momentum to determine if the timing is right for SPUSTN.
Learn more about the Trade Triangles and how we make technical analysis as easy as buy and sell.
|
|||||||||||||||
|
|||||||||||||||
MarketClub’s Trade Triangles for SPUSTN
![]() The long-term trend has been UP since Feb 27th, 2026 at 84.814
The long-term trend has been UP since Feb 27th, 2026 at 84.814
![]() The intermediate-term trend has been DOWN since Mar 8th, 2026 at 83.438
The intermediate-term trend has been DOWN since Mar 8th, 2026 at 83.438
![]() The short-term trend has been DOWN since Mar 11th, 2026 at 83.256
The short-term trend has been DOWN since Mar 11th, 2026 at 83.256
Smart Scan Analysis for SPUSTN
Based on our trend formula, SPUSTN is rated as a -60 on a scale from -100 (Strong Downtrend) to +100 (Strong Uptrend).
| Open | High | Low | Price | Change |
|---|---|---|---|---|
| 82.994 | 83.165 | 82.778 | 82.835 | -0.170 |
| Prev. Close | Volume | Bid | Ask | Time |
| 83.005 | 0 | 2026-03-13 15:32:35 |