Index Trend Analysis Report
Prepared for you on Monday, March 23, 2026.
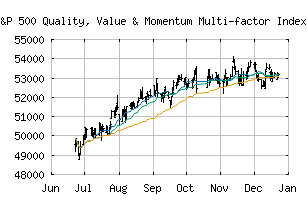
S&P 500 Quality, Value & Momentum Multi-factor Index (GBP) NTR (CME:SPXQVMGN)
Weak Downtrend (-65) - SPXQVMGN is showing signs of a strengthening downtrend. Monitor SPXQVMGN as it may be building momentum to the downside.
Is it time to buy, sell, or avoid SPXQVMGN?
MarketClub looks at technical strength and momentum to determine if the timing is right for SPXQVMGN.
Learn more about the Trade Triangles and how we make technical analysis as easy as buy and sell.
|
|||||||||||||||
|
|||||||||||||||
MarketClub’s Trade Triangles for SPXQVMGN
![]() The long-term trend has been UP since Jul 25th, 2025 at 50875.40
The long-term trend has been UP since Jul 25th, 2025 at 50875.40
![]() The intermediate-term trend has been DOWN since Mar 9th, 2026 at 55682.36
The intermediate-term trend has been DOWN since Mar 9th, 2026 at 55682.36
![]() The short-term trend has been DOWN since Mar 5th, 2026 at 56690.48
The short-term trend has been DOWN since Mar 5th, 2026 at 56690.48
Smart Scan Analysis for SPXQVMGN
Based on our trend formula, SPXQVMGN is rated as a -70 on a scale from -100 (Strong Downtrend) to +100 (Strong Uptrend).
| Open | High | Low | Price | Change |
|---|---|---|---|---|
| 54755.85 | 55703.16 | 54755.85 | 55402.83 | +262.14 |
| Prev. Close | Volume | Bid | Ask | Time |
| 55140.69 | 0 | 2026-03-23 13:10:31 |