Index Trend Analysis Report
Prepared for you on Monday, December 8, 2025.
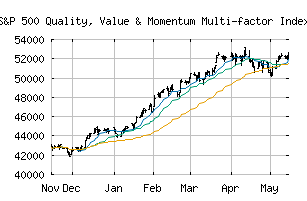
S&P 500 Quality, Value & Momentum Multi-factor Index (GBP) TR (CME:SPXQVMGT)
Crossroads (-60) - SPXQVMGT is struggling to move into a solid trend. Beware of choppy markets and consider a sidelines position until a stronger trend is identified.
Is it time to buy, sell, or avoid SPXQVMGT?
MarketClub looks at technical strength and momentum to determine if the timing is right for SPXQVMGT.
Learn more about the Trade Triangles and how we make technical analysis as easy as buy and sell.
|
|||||||||||||||
|
|||||||||||||||
MarketClub’s Trade Triangles for SPXQVMGT
![]() The long-term trend has been UP since Jul 25th, 2025 at 60363.60
The long-term trend has been UP since Jul 25th, 2025 at 60363.60
![]() The intermediate-term trend has been DOWN since Dec 8th, 2025 at 62569.54
The intermediate-term trend has been DOWN since Dec 8th, 2025 at 62569.54
![]() The short-term trend has been DOWN since Dec 3rd, 2025 at 63516.96
The short-term trend has been DOWN since Dec 3rd, 2025 at 63516.96
Smart Scan Analysis for SPXQVMGT
Based on our trend formula, SPXQVMGT is rated as a -60 on a scale from -100 (Strong Downtrend) to +100 (Strong Uptrend).
| Open | High | Low | Price | Change |
|---|---|---|---|---|
| 62922.83 | 62922.83 | 62377.27 | 62534.07 | -362.82 |
| Prev. Close | Volume | Bid | Ask | Time |
| 62896.89 | 0 | 2025-12-08 16:20:01 |