Index Trend Analysis Report
Prepared for you on Wednesday, March 12, 2025.
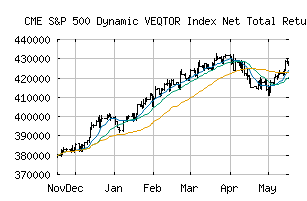
S&P 500 Dynamic VEQTOR Index Net Total Return (CME:SPXTDVUN)
Countertrend Down (-85) - SPXTDVUN is showing short-term strength. However, look for the longer-term bearish trend to resume. As always, continue to monitor the trend score and set stops.
Is it time to buy, sell, or avoid SPXTDVUN?
MarketClub looks at technical strength and momentum to determine if the timing is right for SPXTDVUN.
Learn more about the Trade Triangles and how we make technical analysis as easy as buy and sell.
|
|||||||||||||||
|
|||||||||||||||
MarketClub’s Trade Triangles for SPXTDVUN
![]() The long-term trend has been DOWN since Mar 4th, 2025 at 446028
The long-term trend has been DOWN since Mar 4th, 2025 at 446028
![]() The intermediate-term trend has been DOWN since Feb 27th, 2025 at 453300
The intermediate-term trend has been DOWN since Feb 27th, 2025 at 453300
![]() The short-term trend has been UP since Mar 4th, 2025 at 451238
The short-term trend has been UP since Mar 4th, 2025 at 451238
Smart Scan Analysis for SPXTDVUN
Based on our trend formula, SPXTDVUN is rated as a -85 on a scale from -100 (Strong Downtrend) to +100 (Strong Uptrend).
| Open | High | Low | Price | Change |
|---|---|---|---|---|
| 438327 | 438327 | 438327 | 438327 | 0 |
| Prev. Close | Volume | Bid | Ask | Time |
| 438327 | 0 | 2025-03-12 00:25:38 |