Index Trend Analysis Report
Prepared for you on Thursday, January 2, 2025.
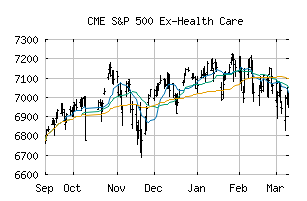
S&P 500 Ex-Health Care (CME:SPXXHCP)
Weak Downtrend (-65) - SPXXHCP is showing signs of a strengthening downtrend. Monitor SPXXHCP as it may be building momentum to the downside.
Is it time to buy, sell, or avoid SPXXHCP?
MarketClub looks at technical strength and momentum to determine if the timing is right for SPXXHCP.
Learn more about the Trade Triangles and how we make technical analysis as easy as buy and sell.
|
|||||||||||||||
|
|||||||||||||||
MarketClub’s Trade Triangles for SPXXHCP
![]() The long-term trend has been UP since Nov 29th, 2023 at 4571.37
The long-term trend has been UP since Nov 29th, 2023 at 4571.37
![]() The intermediate-term trend has been DOWN since Dec 18th, 2024 at 6092.59
The intermediate-term trend has been DOWN since Dec 18th, 2024 at 6092.59
![]() The short-term trend has been DOWN since Dec 30th, 2024 at 6087.32
The short-term trend has been DOWN since Dec 30th, 2024 at 6087.32
Smart Scan Analysis for SPXXHCP
Based on our trend formula, SPXXHCP is rated as a -70 on a scale from -100 (Strong Downtrend) to +100 (Strong Uptrend).
| Open | High | Low | Price | Change |
|---|---|---|---|---|
| 6063.86 | 6089.54 | 6027.81 | 6035.48 | +1.98 |
| Prev. Close | Volume | Bid | Ask | Time |
| 6033.50 | 0 | 2025-01-02 11:07:09 |