Index Trend Analysis Report
Prepared for you on Friday, July 26, 2024.
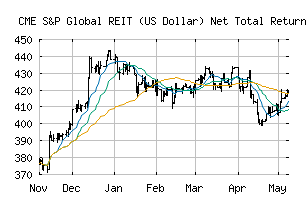
S&P Global REIT (US Dollar) Net Total Return (CME:SREITGUN)
Countertrend Up (+85) - SREITGUN is showing short-term weakness. However, look for the longer-term bullish trend to resume. As always, continue to monitor the trend score and utilize a stop order.
Is it time to buy, sell, or avoid SREITGUN?
MarketClub looks at technical strength and momentum to determine if the timing is right for SREITGUN.
Learn more about the Trade Triangles and how we make technical analysis as easy as buy and sell.
|
|||||||||||||||
|
|||||||||||||||
MarketClub’s Trade Triangles for SREITGUN
![]() The long-term trend has been UP since Jul 11th, 2024 at 433.40
The long-term trend has been UP since Jul 11th, 2024 at 433.40
![]() The intermediate-term trend has been UP since Jun 24th, 2024 at 429.52
The intermediate-term trend has been UP since Jun 24th, 2024 at 429.52
![]() The short-term trend has been DOWN since Jul 24th, 2024 at 448.02
The short-term trend has been DOWN since Jul 24th, 2024 at 448.02
Smart Scan Analysis for SREITGUN
Based on our trend formula, SREITGUN is rated as a +85 on a scale from -100 (Strong Downtrend) to +100 (Strong Uptrend).
| Open | High | Low | Price | Change |
|---|---|---|---|---|
| 442.75 | 449.33 | 442.43 | 448.17 | +5.46 |
| Prev. Close | Volume | Bid | Ask | Time |
| 442.71 | 0 | 2024-07-26 16:38:49 |