Index Trend Analysis Report
Prepared for you on Thursday, March 26, 2026.
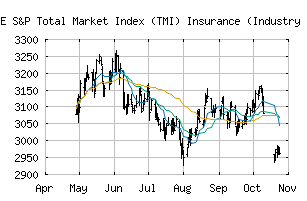
S&P Total Market Index (TMI) Insurance (Industry Group) (CME:STM4030)
Countertrend Down (-85) - STM4030 is showing short-term strength. However, look for the longer-term bearish trend to resume. As always, continue to monitor the trend score and set stops.
Is it time to buy, sell, or avoid STM4030?
MarketClub looks at technical strength and momentum to determine if the timing is right for STM4030.
Learn more about the Trade Triangles and how we make technical analysis as easy as buy and sell.
|
|||||||||||||||
|
|||||||||||||||
MarketClub’s Trade Triangles for STM4030
![]() The long-term trend has been DOWN since Aug 1st, 2025 at 2948.19
The long-term trend has been DOWN since Aug 1st, 2025 at 2948.19
![]() The intermediate-term trend has been DOWN since Mar 9th, 2026 at 2938.11
The intermediate-term trend has been DOWN since Mar 9th, 2026 at 2938.11
![]() The short-term trend has been UP since Mar 23rd, 2026 at 2899.73
The short-term trend has been UP since Mar 23rd, 2026 at 2899.73
Smart Scan Analysis for STM4030
Based on our trend formula, STM4030 is rated as a -85 on a scale from -100 (Strong Downtrend) to +100 (Strong Uptrend).
| Open | High | Low | Price | Change |
|---|---|---|---|---|
| 2865.47 | 2891.32 | 2859.93 | 2865.18 | +2.09 |
| Prev. Close | Volume | Bid | Ask | Time |
| 2863.09 | 0 | 2026-03-26 13:48:03 |
| 52wk High | 1626.01 | 52wk High Date | 2018-01-29 |
| 52wk Low | 1386.38 | 52wk Low Date | 2018-10-26 |