Index Trend Analysis Report
Prepared for you on Tuesday, April 7, 2026.
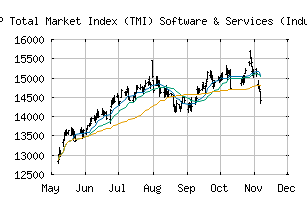
S&P Total Market Index (TMI) Software & Services (Industry Group) (CME:STM4510)
Bear Market Rally (-75) - STM4510 is showing some rallying power, but still remains in the confines of a long-term downtrend. Keep an eye on STM4510 as it may be in the beginning of a reversal.
Is it time to buy, sell, or avoid STM4510?
MarketClub looks at technical strength and momentum to determine if the timing is right for STM4510.
Learn more about the Trade Triangles and how we make technical analysis as easy as buy and sell.
|
|||||||||||||||
|
|||||||||||||||
MarketClub’s Trade Triangles for STM4510
![]() The long-term trend has been DOWN since Nov 14th, 2025 at 14113.64
The long-term trend has been DOWN since Nov 14th, 2025 at 14113.64
![]() The intermediate-term trend has been DOWN since Nov 4th, 2025 at 14820.31
The intermediate-term trend has been DOWN since Nov 4th, 2025 at 14820.31
![]() The short-term trend has been UP since Apr 1st, 2026 at 10714.25
The short-term trend has been UP since Apr 1st, 2026 at 10714.25
Smart Scan Analysis for STM4510
Based on our trend formula, STM4510 is rated as a -75 on a scale from -100 (Strong Downtrend) to +100 (Strong Uptrend).
| Open | High | Low | Price | Change |
|---|---|---|---|---|
| 10692.82 | 10755.49 | 10556.34 | 10743.76 | -8.41 |
| Prev. Close | Volume | Bid | Ask | Time |
| 10752.17 | 0 | 2026-04-07 16:19:33 |
| 52wk High | 5364.06 | 52wk High Date | 2018-07-25 |
| 52wk Low | 4151.48 | 52wk Low Date | 2017-12-05 |