Forex Trend Analysis Report
Prepared for you on Wednesday, December 17, 2025.
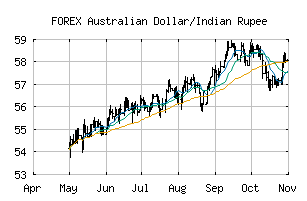
Australian Dollar/Indian Rupee (FOREX:AUDINR)
Countertrend Up (+85) - AUDINR is showing short-term weakness. However, look for the longer-term bullish trend to resume. As always, continue to monitor the trend score and utilize a stop order.
Is it time to buy, sell, or avoid AUDINR?
MarketClub looks at technical strength and momentum to determine if the timing is right for AUDINR.
Learn more about the Trade Triangles and how we make technical analysis as easy as buy and sell.
|
|||||||||||||||
|
|||||||||||||||
MarketClub’s Trade Triangles for AUDINR
![]() The long-term trend has been UP since May 22nd, 2025 at 55.482938
The long-term trend has been UP since May 22nd, 2025 at 55.482938
![]() The intermediate-term trend has been UP since Nov 27th, 2025 at 58.337014
The intermediate-term trend has been UP since Nov 27th, 2025 at 58.337014
![]() The short-term trend has been DOWN since Dec 16th, 2025 at 60.003967
The short-term trend has been DOWN since Dec 16th, 2025 at 60.003967
Smart Scan Analysis for AUDINR
Based on our trend formula, AUDINR is rated as a +85 on a scale from -100 (Strong Downtrend) to +100 (Strong Uptrend).
| Open | High | Low | Price | Change |
|---|---|---|---|---|
| 59.809278 | 59.879181 | 59.729495 | 59.862373 | +0.053095 |
| Prev. Close | Volume | Bid | Ask | Time |
| 59.809278 | 2025-12-17 10:29:12 |