Forex Trend Analysis Report
Prepared for you on Friday, June 13, 2025.
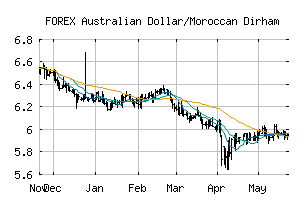
Australian Dollar/Moroccan Dirham (FOREX:AUDMAD)
Strong Downtrend (-100) - AUDMAD is in a strong downtrend that is likely to continue. With short-term, intermediate, and long-term bearish momentum, AUDMAD continues to fall. Traders should use caution and set stops.
Is it time to buy, sell, or avoid AUDMAD?
MarketClub looks at technical strength and momentum to determine if the timing is right for AUDMAD.
Learn more about the Trade Triangles and how we make technical analysis as easy as buy and sell.
|
|||||||||||||||
|
|||||||||||||||
MarketClub’s Trade Triangles for AUDMAD
![]() The long-term trend has been DOWN since Mar 3rd, 2025 at 6.1628153
The long-term trend has been DOWN since Mar 3rd, 2025 at 6.1628153
![]() The intermediate-term trend has been DOWN since Jun 12th, 2025 at 5.9099672
The intermediate-term trend has been DOWN since Jun 12th, 2025 at 5.9099672
![]() The short-term trend has been DOWN since Jun 11th, 2025 at 5.9501013
The short-term trend has been DOWN since Jun 11th, 2025 at 5.9501013
Smart Scan Analysis for AUDMAD
Based on our trend formula, AUDMAD is rated as a -100 on a scale from -100 (Strong Downtrend) to +100 (Strong Uptrend).
| Open | High | Low | Price | Change |
|---|---|---|---|---|
| 5.9120293 | 5.9653178 | 5.8898355 | 5.9153105 | +0.0032810 |
| Prev. Close | Volume | Bid | Ask | Time |
| 5.9120293 | 2025-06-13 15:45:23 |