Forex Trend Analysis Report
Prepared for you on Tuesday, April 21, 2026.
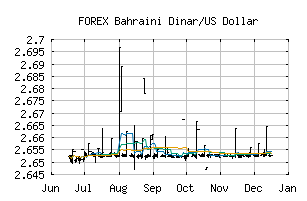
Bahraini Dinar/US Dollar (FOREX:BHDUSD)
Weak Downtrend (-65) - BHDUSD is showing signs of a strengthening downtrend. Monitor BHDUSD as it may be building momentum to the downside.
Is it time to buy, sell, or avoid BHDUSD?
MarketClub looks at technical strength and momentum to determine if the timing is right for BHDUSD.
Learn more about the Trade Triangles and how we make technical analysis as easy as buy and sell.
|
|||||||||||||||
|
|||||||||||||||
MarketClub’s Trade Triangles for BHDUSD
![]() The long-term trend has been DOWN since Jan 30th, 2026 at 2.6459643
The long-term trend has been DOWN since Jan 30th, 2026 at 2.6459643
![]() The intermediate-term trend has been DOWN since Apr 17th, 2026 at 2.6422988
The intermediate-term trend has been DOWN since Apr 17th, 2026 at 2.6422988
![]() The short-term trend has been DOWN since Apr 17th, 2026 at 2.6494577
The short-term trend has been DOWN since Apr 17th, 2026 at 2.6494577
Smart Scan Analysis for BHDUSD
Based on our trend formula, BHDUSD is rated as a -70 on a scale from -100 (Strong Downtrend) to +100 (Strong Uptrend).
| Open | High | Low | Price | Change |
|---|---|---|---|---|
| 2.649862 | 2.649862 | 2.649862 | 2.649862 | 0.000000 |
| Prev. Close | Volume | Bid | Ask | Time |
| 2.649862 | 2026-04-21 00:06:12 |