Forex Trend Analysis Report
Prepared for you on Friday, May 9, 2025.
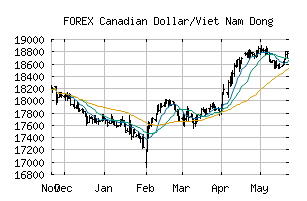
Canadian Dollar/Viet Nam Dong (FOREX:CADVND)
Weak Uptrend (+65) - CADVND is showing signs of weakening momentum to the upside. Monitor CADVND as it may be in the beginning stages of a reversal.
Is it time to buy, sell, or avoid CADVND?
MarketClub looks at technical strength and momentum to determine if the timing is right for CADVND.
Learn more about the Trade Triangles and how we make technical analysis as easy as buy and sell.
|
|||||||||||||||
|
|||||||||||||||
MarketClub’s Trade Triangles for CADVND
![]() The long-term trend has been UP since Apr 2nd, 2025 at 18025.996
The long-term trend has been UP since Apr 2nd, 2025 at 18025.996
![]() The intermediate-term trend has been UP since Mar 24th, 2025 at 17907.347
The intermediate-term trend has been UP since Mar 24th, 2025 at 17907.347
![]() The short-term trend has been DOWN since May 5th, 2025 at 18761.070
The short-term trend has been DOWN since May 5th, 2025 at 18761.070
Smart Scan Analysis for CADVND
Based on our trend formula, CADVND is rated as a +65 on a scale from -100 (Strong Downtrend) to +100 (Strong Uptrend).
| Open | High | Low | Price | Change |
|---|---|---|---|---|
| 18655.189 | 18668.329 | 18646.187 | 18663.405 | +8.216 |
| Prev. Close | Volume | Bid | Ask | Time |
| 18655.189 | 2025-05-09 01:19:23 |