Forex Trend Analysis Report
Prepared for you on Sunday, May 11, 2025.
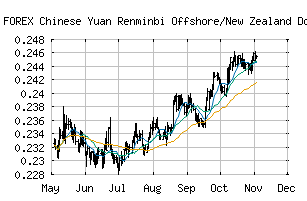
Chinese Yuan Renminbi Offshore/New Zealand Dollar (FOREX:CNHNZD)
Sidelines Mode (-55) - CNHNZD is moving in a sideways pattern and is unable to gain momentum in either direction. Beware of choppy movement and consider a sidelines position until a stronger trend is identified.
Is it time to buy, sell, or avoid CNHNZD?
MarketClub looks at technical strength and momentum to determine if the timing is right for CNHNZD.
Learn more about the Trade Triangles and how we make technical analysis as easy as buy and sell.
|
|||||||||||||||
|
|||||||||||||||
MarketClub’s Trade Triangles for CNHNZD
![]() The long-term trend has been DOWN since Apr 13th, 2025 at 0.23440741
The long-term trend has been DOWN since Apr 13th, 2025 at 0.23440741
![]() The intermediate-term trend has been DOWN since Apr 13th, 2025 at 0.23440741
The intermediate-term trend has been DOWN since Apr 13th, 2025 at 0.23440741
![]() The short-term trend has been UP since May 8th, 2025 at 0.23317192
The short-term trend has been UP since May 8th, 2025 at 0.23317192
Smart Scan Analysis for CNHNZD
Based on our trend formula, CNHNZD is rated as a -55 on a scale from -100 (Strong Downtrend) to +100 (Strong Uptrend).
| Open | High | Low | Price | Change |
|---|---|---|---|---|
| 0.23407784 | 0.23472332 | 0.23337169 | 0.23372101 | -0.00035700 |
| Prev. Close | Volume | Bid | Ask | Time |
| 0.23369213 | 2025-05-09 17:04:45 |