Forex Trend Analysis Report
Prepared for you on Friday, March 27, 2026.
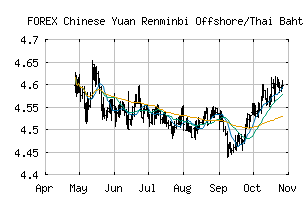
Chinese Yuan Renminbi Offshore/Thai Baht (FOREX:CNHTHB)
Bull Market Weakness (+75) - CNHTHB is showing signs of short-term weakness, but still remains in the confines of a long-term uptrend. Keep an eye on CNHTHB as it may be in the beginning stages of a reversal.
Is it time to buy, sell, or avoid CNHTHB?
MarketClub looks at technical strength and momentum to determine if the timing is right for CNHTHB.
Learn more about the Trade Triangles and how we make technical analysis as easy as buy and sell.
|
|||||||||||||||
|
|||||||||||||||
MarketClub’s Trade Triangles for CNHTHB
![]() The long-term trend has been UP since Feb 4th, 2026 at 4.5755294
The long-term trend has been UP since Feb 4th, 2026 at 4.5755294
![]() The intermediate-term trend has been UP since Dec 29th, 2025 at 4.5175000
The intermediate-term trend has been UP since Dec 29th, 2025 at 4.5175000
![]() The short-term trend has been DOWN since Mar 23rd, 2026 at 4.7151956
The short-term trend has been DOWN since Mar 23rd, 2026 at 4.7151956
Smart Scan Analysis for CNHTHB
Based on our trend formula, CNHTHB is rated as a +75 on a scale from -100 (Strong Downtrend) to +100 (Strong Uptrend).
| Open | High | Low | Price | Change |
|---|---|---|---|---|
| 4.7473994 | 4.7619357 | 4.7401838 | 4.7401838 | -0.0072160 |
| Prev. Close | Volume | Bid | Ask | Time |
| 4.7473994 | 2026-03-27 11:00:28 |