Forex Trend Analysis Report
Prepared for you on Monday, March 16, 2026.
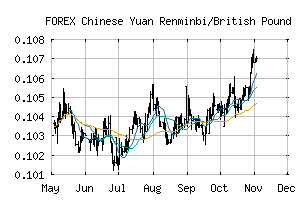
Chinese Yuan Renminbi/British Pound (FOREX:CNYGBP)
Weak Uptrend (+65) - CNYGBP is showing signs of weakening momentum to the upside. Monitor CNYGBP as it may be in the beginning stages of a reversal.
Is it time to buy, sell, or avoid CNYGBP?
MarketClub looks at technical strength and momentum to determine if the timing is right for CNYGBP.
Learn more about the Trade Triangles and how we make technical analysis as easy as buy and sell.
|
|||||||||||||||
|
|||||||||||||||
MarketClub’s Trade Triangles for CNYGBP
![]() The long-term trend has been UP since Feb 26th, 2026 at 0.10789955
The long-term trend has been UP since Feb 26th, 2026 at 0.10789955
![]() The intermediate-term trend has been UP since Feb 17th, 2026 at 0.10668560
The intermediate-term trend has been UP since Feb 17th, 2026 at 0.10668560
![]() The short-term trend has been DOWN since Mar 16th, 2026 at 0.10862116
The short-term trend has been DOWN since Mar 16th, 2026 at 0.10862116
Smart Scan Analysis for CNYGBP
Based on our trend formula, CNYGBP is rated as a +65 on a scale from -100 (Strong Downtrend) to +100 (Strong Uptrend).
| Open | High | Low | Price | Change |
|---|---|---|---|---|
| 0.10932996 | 0.10956631 | 0.10778365 | 0.10805391 | -0.00127600 |
| Prev. Close | Volume | Bid | Ask | Time |
| 0.10932996 | 2026-03-16 21:05:34 |