Forex Trend Analysis Report
Prepared for you on Thursday, March 26, 2026.
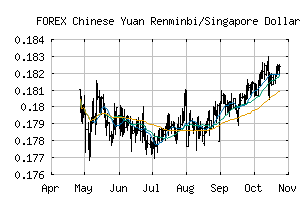
Chinese Yuan Renminbi/Singapore Dollar (FOREX:CNYSGD)
Countertrend Up (+85) - CNYSGD is showing short-term weakness. However, look for the longer-term bullish trend to resume. As always, continue to monitor the trend score and utilize a stop order.
Is it time to buy, sell, or avoid CNYSGD?
MarketClub looks at technical strength and momentum to determine if the timing is right for CNYSGD.
Learn more about the Trade Triangles and how we make technical analysis as easy as buy and sell.
|
|||||||||||||||
|
|||||||||||||||
MarketClub’s Trade Triangles for CNYSGD
![]() The long-term trend has been UP since Apr 14th, 2025 at 0.19167029
The long-term trend has been UP since Apr 14th, 2025 at 0.19167029
![]() The intermediate-term trend has been UP since Feb 24th, 2026 at 0.18404307
The intermediate-term trend has been UP since Feb 24th, 2026 at 0.18404307
![]() The short-term trend has been DOWN since Mar 24th, 2026 at 0.18481126
The short-term trend has been DOWN since Mar 24th, 2026 at 0.18481126
Smart Scan Analysis for CNYSGD
Based on our trend formula, CNYSGD is rated as a +85 on a scale from -100 (Strong Downtrend) to +100 (Strong Uptrend).
| Open | High | Low | Price | Change |
|---|---|---|---|---|
| 0.18576034 | 0.18623278 | 0.18570356 | 0.18607065 | +0.00031000 |
| Prev. Close | Volume | Bid | Ask | Time |
| 0.18576034 | 2026-03-26 14:52:05 |