Forex Trend Analysis Report
Prepared for you on Friday, April 3, 2026.
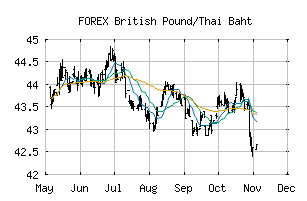
British Pound/Thai Baht (FOREX:GBPTHB)
Weak Uptrend (+65) - GBPTHB is showing signs of weakening momentum to the upside. Monitor GBPTHB as it may be in the beginning stages of a reversal.
Is it time to buy, sell, or avoid GBPTHB?
MarketClub looks at technical strength and momentum to determine if the timing is right for GBPTHB.
Learn more about the Trade Triangles and how we make technical analysis as easy as buy and sell.
|
|||||||||||||||
|
|||||||||||||||
MarketClub’s Trade Triangles for GBPTHB
![]() The long-term trend has been UP since Mar 18th, 2026 at 43.402083
The long-term trend has been UP since Mar 18th, 2026 at 43.402083
![]() The intermediate-term trend has been UP since Mar 9th, 2026 at 42.698366
The intermediate-term trend has been UP since Mar 9th, 2026 at 42.698366
![]() The short-term trend has been DOWN since Mar 30th, 2026 at 43.616376
The short-term trend has been DOWN since Mar 30th, 2026 at 43.616376
Smart Scan Analysis for GBPTHB
Based on our trend formula, GBPTHB is rated as a +65 on a scale from -100 (Strong Downtrend) to +100 (Strong Uptrend).
| Open | High | Low | Price | Change |
|---|---|---|---|---|
| 43.331097 | 43.361888 | 43.141569 | 43.148695 | -0.182402 |
| Prev. Close | Volume | Bid | Ask | Time |
| 43.331097 | 2026-04-02 15:26:46 |