Forex Trend Analysis Report
Prepared for you on Sunday, August 3, 2025.
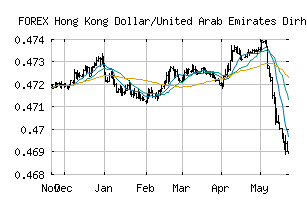
Hong Kong Dollar/United Arab Emirates Dirham (FOREX:HKDAED)
Sidelines Mode (+55) - HKDAED is moving in a sideways pattern and is unable to gain momentum in either direction. Beware of choppy movement and consider a sidelines position until a stronger trend is identified.
Is it time to buy, sell, or avoid HKDAED?
MarketClub looks at technical strength and momentum to determine if the timing is right for HKDAED.
Learn more about the Trade Triangles and how we make technical analysis as easy as buy and sell.
|
|||||||||||||||
|
|||||||||||||||
MarketClub’s Trade Triangles for HKDAED
![]() The long-term trend has been DOWN since May 12th, 2025 at 0.47116693
The long-term trend has been DOWN since May 12th, 2025 at 0.47116693
![]() The intermediate-term trend has been UP since Jul 3rd, 2025 at 0.46809825
The intermediate-term trend has been UP since Jul 3rd, 2025 at 0.46809825
![]() The short-term trend has been DOWN since Jul 28th, 2025 at 0.46784712
The short-term trend has been DOWN since Jul 28th, 2025 at 0.46784712
Smart Scan Analysis for HKDAED
Based on our trend formula, HKDAED is rated as a +55 on a scale from -100 (Strong Downtrend) to +100 (Strong Uptrend).
| Open | High | Low | Price | Change |
|---|---|---|---|---|
| 0.46783610 | 0.46793907 | 0.46783610 | 0.46793102 | +0.00009500 |
| Prev. Close | Volume | Bid | Ask | Time |
| 0.46783610 | 2025-08-01 17:03:49 |