Forex Trend Analysis Report
Prepared for you on Wednesday, March 18, 2026.
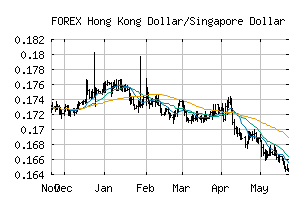
Hong Kong Dollar/Singapore Dollar (FOREX:HKDSGD)
Sidelines Mode (+55) - HKDSGD is moving in a sideways pattern and is unable to gain momentum in either direction. Beware of choppy movement and consider a sidelines position until a stronger trend is identified.
Is it time to buy, sell, or avoid HKDSGD?
MarketClub looks at technical strength and momentum to determine if the timing is right for HKDSGD.
Learn more about the Trade Triangles and how we make technical analysis as easy as buy and sell.
|
|||||||||||||||
|
|||||||||||||||
MarketClub’s Trade Triangles for HKDSGD
![]() The long-term trend has been DOWN since Jan 1st, 2026 at 0.16468714
The long-term trend has been DOWN since Jan 1st, 2026 at 0.16468714
![]() The intermediate-term trend has been UP since Mar 3rd, 2026 at 0.16337139
The intermediate-term trend has been UP since Mar 3rd, 2026 at 0.16337139
![]() The short-term trend has been DOWN since Mar 17th, 2026 at 0.16303469
The short-term trend has been DOWN since Mar 17th, 2026 at 0.16303469
Smart Scan Analysis for HKDSGD
Based on our trend formula, HKDSGD is rated as a +55 on a scale from -100 (Strong Downtrend) to +100 (Strong Uptrend).
| Open | High | Low | Price | Change |
|---|---|---|---|---|
| 0.16287150 | 0.16388776 | 0.16270000 | 0.16379104 | +0.00092000 |
| Prev. Close | Volume | Bid | Ask | Time |
| 0.16287150 | 2026-03-18 19:07:59 |