Forex Trend Analysis Report
Prepared for you on Thursday, July 24, 2025.
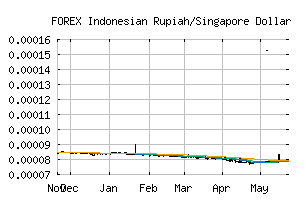
Indonesian Rupiah/Singapore Dollar (FOREX:IDRSGD)
Weak Uptrend (+65) - IDRSGD is showing signs of weakening momentum to the upside. Monitor IDRSGD as it may be in the beginning stages of a reversal.
Is it time to buy, sell, or avoid IDRSGD?
MarketClub looks at technical strength and momentum to determine if the timing is right for IDRSGD.
Learn more about the Trade Triangles and how we make technical analysis as easy as buy and sell.
|
|||||||||||||||
|
|||||||||||||||
MarketClub’s Trade Triangles for IDRSGD
![]() The long-term trend has been UP since May 6th, 2025 at 0.00008361
The long-term trend has been UP since May 6th, 2025 at 0.00008361
![]() The intermediate-term trend has been UP since Jul 1st, 2025 at 0.00007973
The intermediate-term trend has been UP since Jul 1st, 2025 at 0.00007973
![]() The short-term trend has been DOWN since Jul 22nd, 2025 at 0.00007855
The short-term trend has been DOWN since Jul 22nd, 2025 at 0.00007855
Smart Scan Analysis for IDRSGD
Based on our trend formula, IDRSGD is rated as a +65 on a scale from -100 (Strong Downtrend) to +100 (Strong Uptrend).
| Open | High | Low | Price | Change |
|---|---|---|---|---|
| 0.00007860 | 0.00007863 | 0.00007834 | 0.00007849 | 0.00000000 |
| Prev. Close | Volume | Bid | Ask | Time |
| 0.00007860 | 2025-07-24 22:41:12 |