Forex Trend Analysis Report
Prepared for you on Sunday, April 5, 2026.
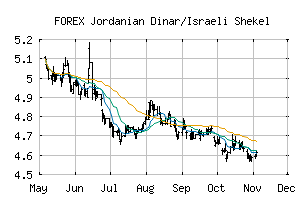
Jordanian Dinar/Israeli Shekel (FOREX:JODILS)
Sidelines Mode (-55) - JODILS is moving in a sideways pattern and is unable to gain momentum in either direction. Beware of choppy movement and consider a sidelines position until a stronger trend is identified.
Is it time to buy, sell, or avoid JODILS?
MarketClub looks at technical strength and momentum to determine if the timing is right for JODILS.
Learn more about the Trade Triangles and how we make technical analysis as easy as buy and sell.
|
|||||||||||||||
|
|||||||||||||||
MarketClub’s Trade Triangles for JODILS
![]() The long-term trend has been DOWN since May 12th, 2025 at 4.9832591
The long-term trend has been DOWN since May 12th, 2025 at 4.9832591
![]() The intermediate-term trend has been UP since Feb 19th, 2026 at 4.4326023
The intermediate-term trend has been UP since Feb 19th, 2026 at 4.4326023
![]() The short-term trend has been DOWN since Apr 1st, 2026 at 4.4137518
The short-term trend has been DOWN since Apr 1st, 2026 at 4.4137518
Smart Scan Analysis for JODILS
Based on our trend formula, JODILS is rated as a -55 on a scale from -100 (Strong Downtrend) to +100 (Strong Uptrend).
| Open | High | Low | Price | Change |
|---|---|---|---|---|
| 4.4222144 | 4.4275740 | 4.4079549 | 4.4151763 | -0.0070380 |
| Prev. Close | Volume | Bid | Ask | Time |
| 4.4222144 | 2026-04-03 11:05:57 |