Forex Trend Analysis Report
Prepared for you on Tuesday, April 14, 2026.
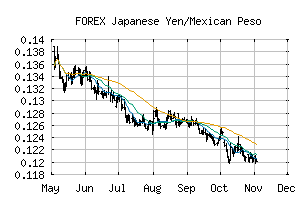
Japanese Yen/Mexican Peso (FOREX:JPYMXN)
Long-Term Downtrend (-90) - JPYMXN is in a strong downtrend that is likely to continue. While JPYMXN is showing intraday strength, it remains in the confines of a bearish trend. Traders should use caution and set stops.
Is it time to buy, sell, or avoid JPYMXN?
MarketClub looks at technical strength and momentum to determine if the timing is right for JPYMXN.
Learn more about the Trade Triangles and how we make technical analysis as easy as buy and sell.
|
|||||||||||||||
|
|||||||||||||||
MarketClub’s Trade Triangles for JPYMXN
![]() The long-term trend has been DOWN since Jun 9th, 2025 at 0.13134724
The long-term trend has been DOWN since Jun 9th, 2025 at 0.13134724
![]() The intermediate-term trend has been DOWN since Apr 7th, 2026 at 0.11067772
The intermediate-term trend has been DOWN since Apr 7th, 2026 at 0.11067772
![]() The short-term trend has been DOWN since Apr 1st, 2026 at 0.11252730
The short-term trend has been DOWN since Apr 1st, 2026 at 0.11252730
Smart Scan Analysis for JPYMXN
Based on our trend formula, JPYMXN is rated as a -90 on a scale from -100 (Strong Downtrend) to +100 (Strong Uptrend).
| Open | High | Low | Price | Change |
|---|---|---|---|---|
| 0.10877283 | 0.10884728 | 0.10835995 | 0.10873231 | -0.00004100 |
| Prev. Close | Volume | Bid | Ask | Time |
| 0.10877283 | 2026-04-14 18:13:06 |