Forex Trend Analysis Report
Prepared for you on Tuesday, July 1, 2025.
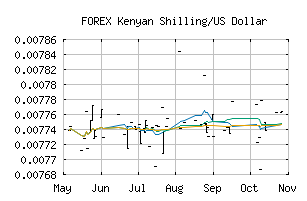
Kenyan Shilling/US Dollar (FOREX:KESUSD)
Strong Downtrend (-100) - KESUSD is in a strong downtrend that is likely to continue. With short-term, intermediate, and long-term bearish momentum, KESUSD continues to fall. Traders should use caution and set stops.
Is it time to buy, sell, or avoid KESUSD?
MarketClub looks at technical strength and momentum to determine if the timing is right for KESUSD.
Learn more about the Trade Triangles and how we make technical analysis as easy as buy and sell.
|
|||||||||||||||
|
|||||||||||||||
MarketClub’s Trade Triangles for KESUSD
![]() The long-term trend has been DOWN since Apr 22nd, 2025 at 0.00764384
The long-term trend has been DOWN since Apr 22nd, 2025 at 0.00764384
![]() The intermediate-term trend has been DOWN since Jun 22nd, 2025 at 0.00772965
The intermediate-term trend has been DOWN since Jun 22nd, 2025 at 0.00772965
![]() The short-term trend has been DOWN since Jun 29th, 2025 at 0.00774115
The short-term trend has been DOWN since Jun 29th, 2025 at 0.00774115
Smart Scan Analysis for KESUSD
Based on our trend formula, KESUSD is rated as a -100 on a scale from -100 (Strong Downtrend) to +100 (Strong Uptrend).
| Open | High | Low | Price | Change |
|---|---|---|---|---|
| 0.00774350 | 0.00774350 | 0.00774062 | 0.00774062 | -0.00000300 |
| Prev. Close | Volume | Bid | Ask | Time |
| 0.00773749 | 2025-06-29 23:06:35 |