Forex Trend Analysis Report
Prepared for you on Friday, March 20, 2026.
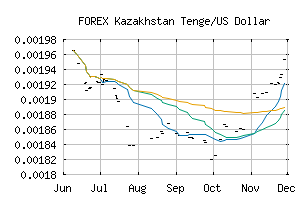
Kazakhstan Tenge/US Dollar (FOREX:KZTUSD)
Countertrend Up (+85) - KZTUSD is showing short-term weakness. However, look for the longer-term bullish trend to resume. As always, continue to monitor the trend score and utilize a stop order.
Is it time to buy, sell, or avoid KZTUSD?
MarketClub looks at technical strength and momentum to determine if the timing is right for KZTUSD.
Learn more about the Trade Triangles and how we make technical analysis as easy as buy and sell.
|
|||||||||||||||
|
|||||||||||||||
MarketClub’s Trade Triangles for KZTUSD
![]() The long-term trend has been UP since Nov 4th, 2025 at 0.00186866
The long-term trend has been UP since Nov 4th, 2025 at 0.00186866
![]() The intermediate-term trend has been UP since Jan 25th, 2026 at 0.00195719
The intermediate-term trend has been UP since Jan 25th, 2026 at 0.00195719
![]() The short-term trend has been UP since Mar 12th, 2026 at 0.00201106
The short-term trend has been UP since Mar 12th, 2026 at 0.00201106
Smart Scan Analysis for KZTUSD
Based on our trend formula, KZTUSD is rated as a +80 on a scale from -100 (Strong Downtrend) to +100 (Strong Uptrend).
| Open | High | Low | Price | Change |
|---|---|---|---|---|
| 0.00208144 | 0.00208144 | 0.00208144 | 0.00208144 | 0.00000000 |
| Prev. Close | Volume | Bid | Ask | Time |
| 0.00209356 | 2026-03-17 14:38:51 |