Forex Trend Analysis Report
Prepared for you on Wednesday, July 2, 2025.
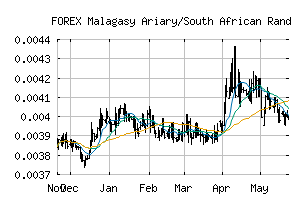
Malagasy Ariary/South African Rand (FOREX:MGAZAR)
Countertrend Up (+85) - MGAZAR is showing short-term weakness. However, look for the longer-term bullish trend to resume. As always, continue to monitor the trend score and utilize a stop order.
Is it time to buy, sell, or avoid MGAZAR?
MarketClub looks at technical strength and momentum to determine if the timing is right for MGAZAR.
Learn more about the Trade Triangles and how we make technical analysis as easy as buy and sell.
|
|||||||||||||||
|
|||||||||||||||
MarketClub’s Trade Triangles for MGAZAR
![]() The long-term trend has been UP since Jan 6th, 2025 at 0.00404183
The long-term trend has been UP since Jan 6th, 2025 at 0.00404183
![]() The intermediate-term trend has been UP since Jun 13th, 2025 at 0.00402983
The intermediate-term trend has been UP since Jun 13th, 2025 at 0.00402983
![]() The short-term trend has been UP since Jul 2nd, 2025 at 0.00405786
The short-term trend has been UP since Jul 2nd, 2025 at 0.00405786
Smart Scan Analysis for MGAZAR
Based on our trend formula, MGAZAR is rated as a +80 on a scale from -100 (Strong Downtrend) to +100 (Strong Uptrend).
| Open | High | Low | Price | Change |
|---|---|---|---|---|
| 0.00403807 | 0.00406123 | 0.00395192 | 0.00400409 | -0.00003400 |
| Prev. Close | Volume | Bid | Ask | Time |
| 0.00403807 | 2025-07-02 21:34:42 |