Forex Trend Analysis Report
Prepared for you on Friday, March 13, 2026.
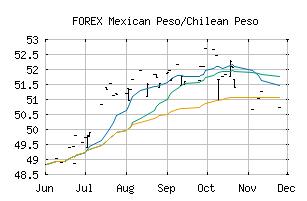
Mexican Peso/Chilean Peso (FOREX:MXNCLP)
Countertrend Up (+85) - MXNCLP is showing short-term weakness. However, look for the longer-term bullish trend to resume. As always, continue to monitor the trend score and utilize a stop order.
Is it time to buy, sell, or avoid MXNCLP?
MarketClub looks at technical strength and momentum to determine if the timing is right for MXNCLP.
Learn more about the Trade Triangles and how we make technical analysis as easy as buy and sell.
|
|||||||||||||||
|
|||||||||||||||
MarketClub’s Trade Triangles for MXNCLP
![]() The long-term trend has been UP since Mar 3rd, 2026 at 50.828659
The long-term trend has been UP since Mar 3rd, 2026 at 50.828659
![]() The intermediate-term trend has been UP since Feb 15th, 2026 at 50.187783
The intermediate-term trend has been UP since Feb 15th, 2026 at 50.187783
![]() The short-term trend has been UP since Feb 15th, 2026 at 50.187783
The short-term trend has been UP since Feb 15th, 2026 at 50.187783
Smart Scan Analysis for MXNCLP
Based on our trend formula, MXNCLP is rated as a +80 on a scale from -100 (Strong Downtrend) to +100 (Strong Uptrend).
| Open | High | Low | Price | Change |
|---|---|---|---|---|
| 50.532446 | 50.532446 | 50.532446 | 50.532446 | 0.000000 |
| Prev. Close | Volume | Bid | Ask | Time |
| 51.551363 | 2026-03-12 18:18:14 |