Forex Trend Analysis Report
Prepared for you on Tuesday, July 1, 2025.
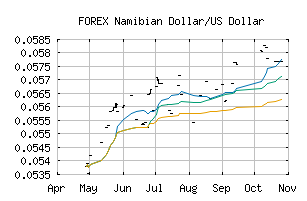
Namibian Dollar/US Dollar (FOREX:NADUSD)
Countertrend Up (+85) - NADUSD is showing short-term weakness. However, look for the longer-term bullish trend to resume. As always, continue to monitor the trend score and utilize a stop order.
Is it time to buy, sell, or avoid NADUSD?
MarketClub looks at technical strength and momentum to determine if the timing is right for NADUSD.
Learn more about the Trade Triangles and how we make technical analysis as easy as buy and sell.
|
|||||||||||||||
|
|||||||||||||||
MarketClub’s Trade Triangles for NADUSD
![]() The long-term trend has been UP since May 20th, 2025 at 0.05542389
The long-term trend has been UP since May 20th, 2025 at 0.05542389
![]() The intermediate-term trend has been UP since Jun 24th, 2025 at 0.05643809
The intermediate-term trend has been UP since Jun 24th, 2025 at 0.05643809
![]() The short-term trend has been UP since Jun 24th, 2025 at 0.05540880
The short-term trend has been UP since Jun 24th, 2025 at 0.05540880
Smart Scan Analysis for NADUSD
Based on our trend formula, NADUSD is rated as a +80 on a scale from -100 (Strong Downtrend) to +100 (Strong Uptrend).
| Open | High | Low | Price | Change |
|---|---|---|---|---|
| 0.05588749 | 0.05588749 | 0.05586675 | 0.05586675 | -0.00002100 |
| Prev. Close | Volume | Bid | Ask | Time |
| 0.05687895 | 2025-06-29 23:06:36 |