Forex Trend Analysis Report
Prepared for you on Wednesday, February 5, 2025.
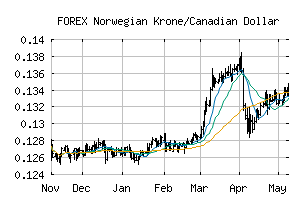
Norwegian Krone/Canadian Dollar (FOREX:NOKCAD)
Countertrend Up (+85) - NOKCAD is showing short-term weakness. However, look for the longer-term bullish trend to resume. As always, continue to monitor the trend score and utilize a stop order.
Is it time to buy, sell, or avoid NOKCAD?
MarketClub looks at technical strength and momentum to determine if the timing is right for NOKCAD.
Learn more about the Trade Triangles and how we make technical analysis as easy as buy and sell.
|
|||||||||||||||
|
|||||||||||||||
MarketClub’s Trade Triangles for NOKCAD
![]() The long-term trend has been UP since Feb 2nd, 2025 at 0.1286765
The long-term trend has been UP since Feb 2nd, 2025 at 0.1286765
![]() The intermediate-term trend has been UP since Jan 20th, 2025 at 0.1275575
The intermediate-term trend has been UP since Jan 20th, 2025 at 0.1275575
![]() The short-term trend has been DOWN since Feb 3rd, 2025 at 0.1273340
The short-term trend has been DOWN since Feb 3rd, 2025 at 0.1273340
Smart Scan Analysis for NOKCAD
Based on our trend formula, NOKCAD is rated as a +85 on a scale from -100 (Strong Downtrend) to +100 (Strong Uptrend).
| Open | High | Low | Price | Change |
|---|---|---|---|---|
| 0.1274795 | 0.1275020 | 0.1274170 | 0.1274790 | 0.0000000 |
| Prev. Close | Volume | Bid | Ask | Time |
| 0.1274795 | 2025-02-05 01:00:23 |