Forex Trend Analysis Report
Prepared for you on Saturday, March 28, 2026.
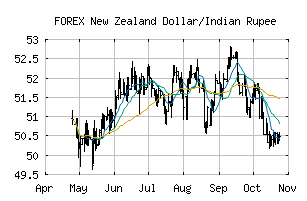
New Zealand Dollar/Indian Rupee (FOREX:NZDINR)
Countertrend Up (+85) - NZDINR is showing short-term weakness. However, look for the longer-term bullish trend to resume. As always, continue to monitor the trend score and utilize a stop order.
Is it time to buy, sell, or avoid NZDINR?
MarketClub looks at technical strength and momentum to determine if the timing is right for NZDINR.
Learn more about the Trade Triangles and how we make technical analysis as easy as buy and sell.
|
|||||||||||||||
|
|||||||||||||||
MarketClub’s Trade Triangles for NZDINR
![]() The long-term trend has been UP since Jan 19th, 2026 at 52.775323
The long-term trend has been UP since Jan 19th, 2026 at 52.775323
![]() The intermediate-term trend has been UP since Mar 20th, 2026 at 54.788524
The intermediate-term trend has been UP since Mar 20th, 2026 at 54.788524
![]() The short-term trend has been DOWN since Mar 26th, 2026 at 54.226840
The short-term trend has been DOWN since Mar 26th, 2026 at 54.226840
Smart Scan Analysis for NZDINR
Based on our trend formula, NZDINR is rated as a +85 on a scale from -100 (Strong Downtrend) to +100 (Strong Uptrend).
| Open | High | Low | Price | Change |
|---|---|---|---|---|
| 54.388746 | 54.699669 | 54.349235 | 54.424340 | +0.035594 |
| Prev. Close | Volume | Bid | Ask | Time |
| 54.388746 | 2026-03-27 19:47:44 |