Forex Trend Analysis Report
Prepared for you on Sunday, March 29, 2026.
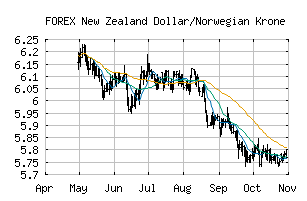
New Zealand Dollar/Norwegian Krone (FOREX:NZDNOK)
Strong Downtrend (-100) - NZDNOK is in a strong downtrend that is likely to continue. With short-term, intermediate, and long-term bearish momentum, NZDNOK continues to fall. Traders should use caution and set stops.
Is it time to buy, sell, or avoid NZDNOK?
MarketClub looks at technical strength and momentum to determine if the timing is right for NZDNOK.
Learn more about the Trade Triangles and how we make technical analysis as easy as buy and sell.
|
|||||||||||||||
|
|||||||||||||||
MarketClub’s Trade Triangles for NZDNOK
![]() The long-term trend has been DOWN since Oct 13th, 2024 at 6.3950
The long-term trend has been DOWN since Oct 13th, 2024 at 6.3950
![]() The intermediate-term trend has been DOWN since Feb 10th, 2026 at 5.7727
The intermediate-term trend has been DOWN since Feb 10th, 2026 at 5.7727
![]() The short-term trend has been DOWN since Mar 26th, 2026 at 5.5651
The short-term trend has been DOWN since Mar 26th, 2026 at 5.5651
Smart Scan Analysis for NZDNOK
Based on our trend formula, NZDNOK is rated as a -100 on a scale from -100 (Strong Downtrend) to +100 (Strong Uptrend).
| Open | High | Low | Price | Change |
|---|---|---|---|---|
| 5.60505 | 5.60920 | 5.58030 | 5.58340 | -0.02165 |
| Prev. Close | Volume | Bid | Ask | Time |
| 5.60505 | 2026-03-29 22:39:23 |