Forex Trend Analysis Report
Prepared for you on Saturday, April 18, 2026.
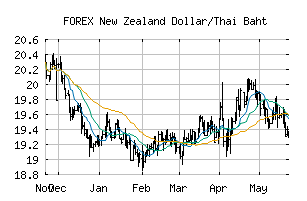
New Zealand Dollar/Thai Baht (FOREX:NZDTHB)
Sidelines Mode (-50) - NZDTHB is failing to move into a strong trend and is encountering choppy trading conditions. Be cautious and consider taking a sidelines position until NZDTHB can gain momentum.
Is it time to buy, sell, or avoid NZDTHB?
MarketClub looks at technical strength and momentum to determine if the timing is right for NZDTHB.
Learn more about the Trade Triangles and how we make technical analysis as easy as buy and sell.
|
|||||||||||||||
|
|||||||||||||||
MarketClub’s Trade Triangles for NZDTHB
![]() The long-term trend has been UP since Jan 29th, 2026 at 18.988229
The long-term trend has been UP since Jan 29th, 2026 at 18.988229
![]() The intermediate-term trend has been DOWN since Apr 2nd, 2026 at 18.626246
The intermediate-term trend has been DOWN since Apr 2nd, 2026 at 18.626246
![]() The short-term trend has been DOWN since Apr 17th, 2026 at 18.794316
The short-term trend has been DOWN since Apr 17th, 2026 at 18.794316
Smart Scan Analysis for NZDTHB
Based on our trend formula, NZDTHB is rated as a -50 on a scale from -100 (Strong Downtrend) to +100 (Strong Uptrend).
| Open | High | Low | Price | Change |
|---|---|---|---|---|
| 18.890609 | 18.890609 | 18.890609 | 18.890609 | 0.000000 |
| Prev. Close | Volume | Bid | Ask | Time |
| 18.890609 | 2026-04-18 04:52:16 |