Forex Trend Analysis Report
Prepared for you on Sunday, April 19, 2026.
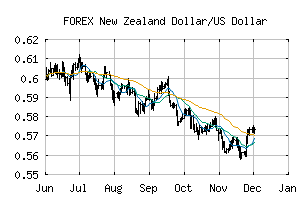
New Zealand Dollar/US Dollar (FOREX:NZDUSD)
Sidelines Mode (-55) - NZDUSD is moving in a sideways pattern and is unable to gain momentum in either direction. Beware of choppy movement and consider a sidelines position until a stronger trend is identified.
Is it time to buy, sell, or avoid NZDUSD?
MarketClub looks at technical strength and momentum to determine if the timing is right for NZDUSD.
Learn more about the Trade Triangles and how we make technical analysis as easy as buy and sell.
|
|||||||||||||||
|
|||||||||||||||
MarketClub’s Trade Triangles for NZDUSD
![]() The long-term trend has been DOWN since Mar 30th, 2026 at 0.57110
The long-term trend has been DOWN since Mar 30th, 2026 at 0.57110
![]() The intermediate-term trend has been UP since Apr 14th, 2026 at 0.58869
The intermediate-term trend has been UP since Apr 14th, 2026 at 0.58869
![]() The short-term trend has been DOWN since Apr 18th, 2026 at 0.58790
The short-term trend has been DOWN since Apr 18th, 2026 at 0.58790
Smart Scan Analysis for NZDUSD
Based on our trend formula, NZDUSD is rated as a -55 on a scale from -100 (Strong Downtrend) to +100 (Strong Uptrend).
| Open | High | Low | Price | Change |
|---|---|---|---|---|
| 0.58810 | 0.58825 | 0.58465 | 0.58825 | +0.00015 |
| Prev. Close | Volume | Bid | Ask | Time |
| 0.58810 | 2026-04-18 22:40:38 |