Forex Trend Analysis Report
Prepared for you on Wednesday, April 8, 2026.
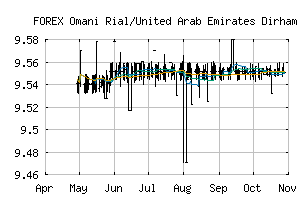
Omani Rial/United Arab Emirates Dirham (FOREX:OMRAED)
Crossroads (-60) - OMRAED is struggling to move into a solid trend. Beware of choppy markets and consider a sidelines position until a stronger trend is identified.
Is it time to buy, sell, or avoid OMRAED?
MarketClub looks at technical strength and momentum to determine if the timing is right for OMRAED.
Learn more about the Trade Triangles and how we make technical analysis as easy as buy and sell.
|
|||||||||||||||
|
|||||||||||||||
MarketClub’s Trade Triangles for OMRAED
![]() The long-term trend has been DOWN since Feb 27th, 2026 at 9.488940
The long-term trend has been DOWN since Feb 27th, 2026 at 9.488940
![]() The intermediate-term trend has been UP since Apr 7th, 2026 at 9.559002
The intermediate-term trend has been UP since Apr 7th, 2026 at 9.559002
![]() The short-term trend has been UP since Apr 7th, 2026 at 9.554492
The short-term trend has been UP since Apr 7th, 2026 at 9.554492
Smart Scan Analysis for OMRAED
Based on our trend formula, OMRAED is rated as a -60 on a scale from -100 (Strong Downtrend) to +100 (Strong Uptrend).
| Open | High | Low | Price | Change |
|---|---|---|---|---|
| 9.551366 | 9.562170 | 9.548471 | 9.548613 | -0.002753 |
| Prev. Close | Volume | Bid | Ask | Time |
| 9.551366 | 2026-04-07 20:21:14 |