Forex Trend Analysis Report
Prepared for you on Saturday, March 21, 2026.
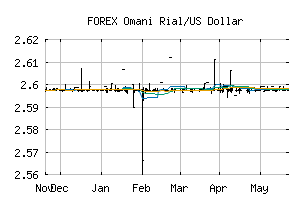
Omani Rial/US Dollar (FOREX:OMRUSD)
Long-Term Uptrend (+90) - OMRUSD is in a strong uptrend that is likely to continue. While OMRUSD is showing intraday weakness, it remains in the confines of a bullish trend. Traders should use caution and utilize a stop order.
Is it time to buy, sell, or avoid OMRUSD?
MarketClub looks at technical strength and momentum to determine if the timing is right for OMRUSD.
Learn more about the Trade Triangles and how we make technical analysis as easy as buy and sell.
|
|||||||||||||||
|
|||||||||||||||
MarketClub’s Trade Triangles for OMRUSD
![]() The long-term trend has been UP since Mar 20th, 2026 at 2.6129793
The long-term trend has been UP since Mar 20th, 2026 at 2.6129793
![]() The intermediate-term trend has been UP since Mar 20th, 2026 at 2.6073283
The intermediate-term trend has been UP since Mar 20th, 2026 at 2.6073283
![]() The short-term trend has been UP since Mar 17th, 2026 at 2.6011272
The short-term trend has been UP since Mar 17th, 2026 at 2.6011272
Smart Scan Analysis for OMRUSD
Based on our trend formula, OMRUSD is rated as a +90 on a scale from -100 (Strong Downtrend) to +100 (Strong Uptrend).
| Open | High | Low | Price | Change |
|---|---|---|---|---|
| 2.6074122 | 2.6074122 | 2.6074122 | 2.6074122 | 0.0000000 |
| Prev. Close | Volume | Bid | Ask | Time |
| 2.6074122 | 2026-03-21 04:10:11 |