Forex Trend Analysis Report
Prepared for you on Thursday, June 26, 2025.
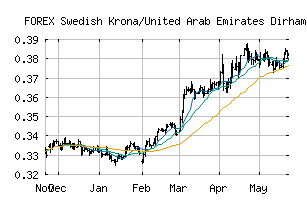
Swedish Krona/United Arab Emirates Dirham (FOREX:SEKAED)
Weak Uptrend (+65) - SEKAED is showing signs of weakening momentum to the upside. Monitor SEKAED as it may be in the beginning stages of a reversal.
Is it time to buy, sell, or avoid SEKAED?
MarketClub looks at technical strength and momentum to determine if the timing is right for SEKAED.
Learn more about the Trade Triangles and how we make technical analysis as easy as buy and sell.
|
|||||||||||||||
|
|||||||||||||||
MarketClub’s Trade Triangles for SEKAED
![]() The long-term trend has been UP since Feb 20th, 2025 at 0.34497738
The long-term trend has been UP since Feb 20th, 2025 at 0.34497738
![]() The intermediate-term trend has been DOWN since Jun 22nd, 2025 at 0.37870610
The intermediate-term trend has been DOWN since Jun 22nd, 2025 at 0.37870610
![]() The short-term trend has been UP since Jun 24th, 2025 at 0.38392315
The short-term trend has been UP since Jun 24th, 2025 at 0.38392315
Smart Scan Analysis for SEKAED
Based on our trend formula, SEKAED is rated as a +65 on a scale from -100 (Strong Downtrend) to +100 (Strong Uptrend).
| Open | High | Low | Price | Change |
|---|---|---|---|---|
| 0.38870475 | 0.38874882 | 0.38819427 | 0.38820712 | -0.00049800 |
| Prev. Close | Volume | Bid | Ask | Time |
| 0.38870475 | 2025-06-26 00:20:51 |