Forex Trend Analysis Report
Prepared for you on Friday, May 9, 2025.
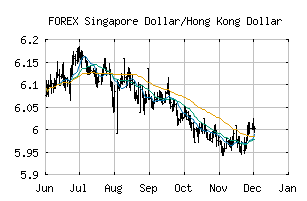
Singapore Dollar/Hong Kong Dollar (FOREX:SGDHKD)
Countertrend Up (+85) - SGDHKD is showing short-term weakness. However, look for the longer-term bullish trend to resume. As always, continue to monitor the trend score and utilize a stop order.
Is it time to buy, sell, or avoid SGDHKD?
MarketClub looks at technical strength and momentum to determine if the timing is right for SGDHKD.
Learn more about the Trade Triangles and how we make technical analysis as easy as buy and sell.
|
|||||||||||||||
|
|||||||||||||||
MarketClub’s Trade Triangles for SGDHKD
![]() The long-term trend has been UP since Apr 10th, 2025 at 5.8562471
The long-term trend has been UP since Apr 10th, 2025 at 5.8562471
![]() The intermediate-term trend has been UP since Apr 10th, 2025 at 5.8492660
The intermediate-term trend has been UP since Apr 10th, 2025 at 5.8492660
![]() The short-term trend has been DOWN since May 8th, 2025 at 5.9749576
The short-term trend has been DOWN since May 8th, 2025 at 5.9749576
Smart Scan Analysis for SGDHKD
Based on our trend formula, SGDHKD is rated as a +85 on a scale from -100 (Strong Downtrend) to +100 (Strong Uptrend).
| Open | High | Low | Price | Change |
|---|---|---|---|---|
| 5.9799899 | 5.9925383 | 5.9617332 | 5.9873068 | +0.0073170 |
| Prev. Close | Volume | Bid | Ask | Time |
| 5.9799899 | 2025-05-09 04:26:56 |