Forex Trend Analysis Report
Prepared for you on Monday, April 6, 2026.
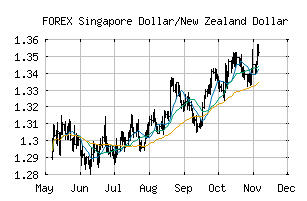
Singapore Dollar/New Zealand Dollar (FOREX:SGDNZD)
Long-Term Uptrend (+90) - SGDNZD is in a strong uptrend that is likely to continue. While SGDNZD is showing intraday weakness, it remains in the confines of a bullish trend. Traders should use caution and utilize a stop order.
Is it time to buy, sell, or avoid SGDNZD?
MarketClub looks at technical strength and momentum to determine if the timing is right for SGDNZD.
Learn more about the Trade Triangles and how we make technical analysis as easy as buy and sell.
|
|||||||||||||||
|
|||||||||||||||
MarketClub’s Trade Triangles for SGDNZD
![]() The long-term trend has been UP since Mar 13th, 2026 at 1.3590942
The long-term trend has been UP since Mar 13th, 2026 at 1.3590942
![]() The intermediate-term trend has been UP since Feb 19th, 2026 at 1.3259150
The intermediate-term trend has been UP since Feb 19th, 2026 at 1.3259150
![]() The short-term trend has been UP since Mar 23rd, 2026 at 1.3437850
The short-term trend has been UP since Mar 23rd, 2026 at 1.3437850
Smart Scan Analysis for SGDNZD
Based on our trend formula, SGDNZD is rated as a +90 on a scale from -100 (Strong Downtrend) to +100 (Strong Uptrend).
| Open | High | Low | Price | Change |
|---|---|---|---|---|
| 1.36368 | 1.36377 | 1.36246 | 1.36313 | -0.00055 |
| Prev. Close | Volume | Bid | Ask | Time |
| 1.36368 | 2026-04-06 02:39:43 |