Forex Trend Analysis Report
Prepared for you on Tuesday, July 1, 2025.
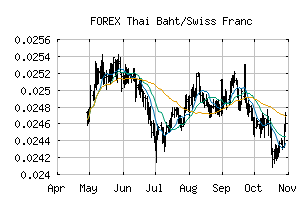
Thai Baht/Swiss Franc (FOREX:THBCHF)
Long-Term Downtrend (-90) - THBCHF is in a strong downtrend that is likely to continue. While THBCHF is showing intraday strength, it remains in the confines of a bearish trend. Traders should use caution and set stops.
Is it time to buy, sell, or avoid THBCHF?
MarketClub looks at technical strength and momentum to determine if the timing is right for THBCHF.
Learn more about the Trade Triangles and how we make technical analysis as easy as buy and sell.
|
|||||||||||||||
|
|||||||||||||||
MarketClub’s Trade Triangles for THBCHF
![]() The long-term trend has been DOWN since Apr 1st, 2025 at 0.02584441
The long-term trend has been DOWN since Apr 1st, 2025 at 0.02584441
![]() The intermediate-term trend has been DOWN since Jun 12th, 2025 at 0.02498782
The intermediate-term trend has been DOWN since Jun 12th, 2025 at 0.02498782
![]() The short-term trend has been DOWN since Jun 12th, 2025 at 0.02509104
The short-term trend has been DOWN since Jun 12th, 2025 at 0.02509104
Smart Scan Analysis for THBCHF
Based on our trend formula, THBCHF is rated as a -90 on a scale from -100 (Strong Downtrend) to +100 (Strong Uptrend).
| Open | High | Low | Price | Change |
|---|---|---|---|---|
| 0.02441337 | 0.02442043 | 0.02428564 | 0.02435009 | -0.00006300 |
| Prev. Close | Volume | Bid | Ask | Time |
| 0.02441337 | 2025-07-01 07:49:21 |