Forex Trend Analysis Report
Prepared for you on Sunday, April 5, 2026.
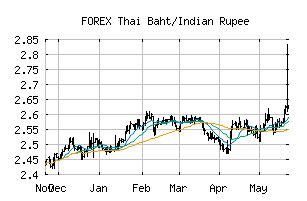
Thai Baht/Indian Rupee (FOREX:THBINR)
Crossroads (-60) - THBINR is struggling to move into a solid trend. Beware of choppy markets and consider a sidelines position until a stronger trend is identified.
Is it time to buy, sell, or avoid THBINR?
MarketClub looks at technical strength and momentum to determine if the timing is right for THBINR.
Learn more about the Trade Triangles and how we make technical analysis as easy as buy and sell.
|
|||||||||||||||
|
|||||||||||||||
MarketClub’s Trade Triangles for THBINR
![]() The long-term trend has been UP since Jul 12th, 2024 at 2.3233851
The long-term trend has been UP since Jul 12th, 2024 at 2.3233851
![]() The intermediate-term trend has been DOWN since Mar 6th, 2026 at 2.8728873
The intermediate-term trend has been DOWN since Mar 6th, 2026 at 2.8728873
![]() The short-term trend has been DOWN since Mar 29th, 2026 at 2.8521781
The short-term trend has been DOWN since Mar 29th, 2026 at 2.8521781
Smart Scan Analysis for THBINR
Based on our trend formula, THBINR is rated as a -60 on a scale from -100 (Strong Downtrend) to +100 (Strong Uptrend).
| Open | High | Low | Price | Change |
|---|---|---|---|---|
| 2.8353762 | 2.8515904 | 2.8320245 | 2.8490424 | +0.0136660 |
| Prev. Close | Volume | Bid | Ask | Time |
| 2.8490424 | 2026-04-03 21:24:55 |