Forex Trend Analysis Report
Prepared for you on Wednesday, July 16, 2025.
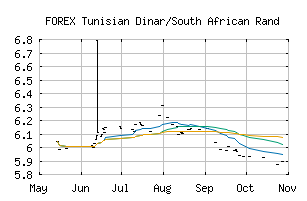
Tunisian Dinar/South African Rand (FOREX:TNDZAR)
Countertrend Up (+85) - TNDZAR is showing short-term weakness. However, look for the longer-term bullish trend to resume. As always, continue to monitor the trend score and utilize a stop order.
Is it time to buy, sell, or avoid TNDZAR?
MarketClub looks at technical strength and momentum to determine if the timing is right for TNDZAR.
Learn more about the Trade Triangles and how we make technical analysis as easy as buy and sell.
|
|||||||||||||||
|
|||||||||||||||
MarketClub’s Trade Triangles for TNDZAR
![]() The long-term trend has been UP since Jan 7th, 2025 at 5.7839216
The long-term trend has been UP since Jan 7th, 2025 at 5.7839216
![]() The intermediate-term trend has been UP since Jun 9th, 2025 at 5.9955262
The intermediate-term trend has been UP since Jun 9th, 2025 at 5.9955262
![]() The short-term trend has been UP since Jul 11th, 2025 at 6.1548857
The short-term trend has been UP since Jul 11th, 2025 at 6.1548857
Smart Scan Analysis for TNDZAR
Based on our trend formula, TNDZAR is rated as a +80 on a scale from -100 (Strong Downtrend) to +100 (Strong Uptrend).
| Open | High | Low | Price | Change |
|---|---|---|---|---|
| 6.1857304 | 6.1857304 | 6.1721115 | 6.1721115 | -0.0136190 |
| Prev. Close | Volume | Bid | Ask | Time |
| 6.1857304 | 2025-07-15 22:45:05 |