Forex Trend Analysis Report
Prepared for you on Friday, March 27, 2026.
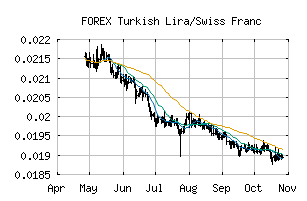
Turkish Lira/Swiss Franc (FOREX:TRYCHF)
Bull Market Weakness (+75) - TRYCHF is showing signs of short-term weakness, but still remains in the confines of a long-term uptrend. Keep an eye on TRYCHF as it may be in the beginning stages of a reversal.
Is it time to buy, sell, or avoid TRYCHF?
MarketClub looks at technical strength and momentum to determine if the timing is right for TRYCHF.
Learn more about the Trade Triangles and how we make technical analysis as easy as buy and sell.
|
|||||||||||||||
|
|||||||||||||||
MarketClub’s Trade Triangles for TRYCHF
![]() The long-term trend has been DOWN since Apr 3rd, 2023 at 0.0473961
The long-term trend has been DOWN since Apr 3rd, 2023 at 0.0473961
![]() The intermediate-term trend has been UP since Mar 13th, 2026 at 0.0179150
The intermediate-term trend has been UP since Mar 13th, 2026 at 0.0179150
![]() The short-term trend has been UP since Mar 26th, 2026 at 0.0179050
The short-term trend has been UP since Mar 26th, 2026 at 0.0179050
Smart Scan Analysis for TRYCHF
Based on our trend formula, TRYCHF is rated as a +70 on a scale from -100 (Strong Downtrend) to +100 (Strong Uptrend).
| Open | High | Low | Price | Change |
|---|---|---|---|---|
| 0.01787867 | 0.01790450 | 0.01786564 | 0.01787429 | -0.00000400 |
| Prev. Close | Volume | Bid | Ask | Time |
| 0.01787867 | 2026-03-27 01:53:12 |