Forex Trend Analysis Report
Prepared for you on Friday, July 11, 2025.
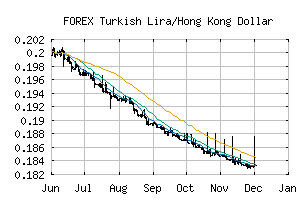
Turkish Lira/Hong Kong Dollar (FOREX:TRYHKD)
Strong Downtrend (-100) - TRYHKD is in a strong downtrend that is likely to continue. With short-term, intermediate, and long-term bearish momentum, TRYHKD continues to fall. Traders should use caution and set stops.
Is it time to buy, sell, or avoid TRYHKD?
MarketClub looks at technical strength and momentum to determine if the timing is right for TRYHKD.
Learn more about the Trade Triangles and how we make technical analysis as easy as buy and sell.
|
|||||||||||||||
|
|||||||||||||||
MarketClub’s Trade Triangles for TRYHKD
![]() The long-term trend has been DOWN since Mar 13th, 2023 at 0.40965
The long-term trend has been DOWN since Mar 13th, 2023 at 0.40965
![]() The intermediate-term trend has been DOWN since May 22nd, 2025 at 0.20055
The intermediate-term trend has been DOWN since May 22nd, 2025 at 0.20055
![]() The short-term trend has been DOWN since Jul 10th, 2025 at 0.19590
The short-term trend has been DOWN since Jul 10th, 2025 at 0.19590
Smart Scan Analysis for TRYHKD
Based on our trend formula, TRYHKD is rated as a -100 on a scale from -100 (Strong Downtrend) to +100 (Strong Uptrend).
| Open | High | Low | Price | Change |
|---|---|---|---|---|
| 0.19550 | 0.19550 | 0.19545 | 0.19545 | -0.00005 |
| Prev. Close | Volume | Bid | Ask | Time |
| 0.19550 | 2025-07-11 04:10:09 |