Forex Trend Analysis Report
Prepared for you on Wednesday, July 30, 2025.
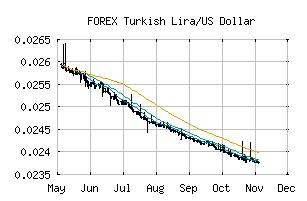
Turkish Lira/US Dollar (FOREX:TRYUSD)
Strong Downtrend (-100) - TRYUSD is in a strong downtrend that is likely to continue. With short-term, intermediate, and long-term bearish momentum, TRYUSD continues to fall. Traders should use caution and set stops.
Is it time to buy, sell, or avoid TRYUSD?
MarketClub looks at technical strength and momentum to determine if the timing is right for TRYUSD.
Learn more about the Trade Triangles and how we make technical analysis as easy as buy and sell.
|
|||||||||||||||
|
|||||||||||||||
MarketClub’s Trade Triangles for TRYUSD
![]() The long-term trend has been DOWN since Nov 5th, 2023 at 0.03501500
The long-term trend has been DOWN since Nov 5th, 2023 at 0.03501500
![]() The intermediate-term trend has been DOWN since May 9th, 2025 at 0.02580485
The intermediate-term trend has been DOWN since May 9th, 2025 at 0.02580485
![]() The short-term trend has been DOWN since Jul 30th, 2025 at 0.02463576
The short-term trend has been DOWN since Jul 30th, 2025 at 0.02463576
Smart Scan Analysis for TRYUSD
Based on our trend formula, TRYUSD is rated as a -100 on a scale from -100 (Strong Downtrend) to +100 (Strong Uptrend).
| Open | High | Low | Price | Change |
|---|---|---|---|---|
| 0.02464620 | 0.02466140 | 0.02463500 | 0.02464299 | -0.00000300 |
| Prev. Close | Volume | Bid | Ask | Time |
| 0.02464620 | 2025-07-30 07:59:42 |