Forex Trend Analysis Report
Prepared for you on Thursday, April 9, 2026.
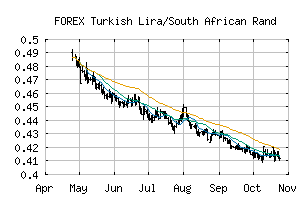
Turkish Lira/South African Rand (FOREX:TRYZAR)
Long-Term Downtrend (-90) - TRYZAR is in a strong downtrend that is likely to continue. While TRYZAR is showing intraday strength, it remains in the confines of a bearish trend. Traders should use caution and set stops.
Is it time to buy, sell, or avoid TRYZAR?
MarketClub looks at technical strength and momentum to determine if the timing is right for TRYZAR.
Learn more about the Trade Triangles and how we make technical analysis as easy as buy and sell.
|
|||||||||||||||
|
|||||||||||||||
MarketClub’s Trade Triangles for TRYZAR
![]() The long-term trend has been DOWN since Mar 14th, 2025 at 0.49490000
The long-term trend has been DOWN since Mar 14th, 2025 at 0.49490000
![]() The intermediate-term trend has been DOWN since Apr 7th, 2026 at 0.37461582
The intermediate-term trend has been DOWN since Apr 7th, 2026 at 0.37461582
![]() The short-term trend has been DOWN since Mar 31st, 2026 at 0.38263799
The short-term trend has been DOWN since Mar 31st, 2026 at 0.38263799
Smart Scan Analysis for TRYZAR
Based on our trend formula, TRYZAR is rated as a -90 on a scale from -100 (Strong Downtrend) to +100 (Strong Uptrend).
| Open | High | Low | Price | Change |
|---|---|---|---|---|
| 0.36954812 | 0.37025579 | 0.36768860 | 0.36897665 | -0.00057100 |
| Prev. Close | Volume | Bid | Ask | Time |
| 0.36954812 | 2026-04-09 09:02:10 |