Forex Trend Analysis Report
Prepared for you on Monday, September 15, 2025.
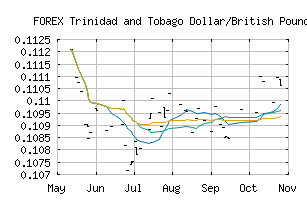
Trinidad and Tobago Dollar/British Pound (FOREX:TTDGBP)
Strong Downtrend (-100) - TTDGBP is in a strong downtrend that is likely to continue. With short-term, intermediate, and long-term bearish momentum, TTDGBP continues to fall. Traders should use caution and set stops.
Is it time to buy, sell, or avoid TTDGBP?
MarketClub looks at technical strength and momentum to determine if the timing is right for TTDGBP.
Learn more about the Trade Triangles and how we make technical analysis as easy as buy and sell.
|
|||||||||||||||
|
|||||||||||||||
MarketClub’s Trade Triangles for TTDGBP
![]() The long-term trend has been DOWN since Mar 6th, 2025 at 0.11545290
The long-term trend has been DOWN since Mar 6th, 2025 at 0.11545290
![]() The intermediate-term trend has been DOWN since Sep 12th, 2025 at 0.10872222
The intermediate-term trend has been DOWN since Sep 12th, 2025 at 0.10872222
![]() The short-term trend has been DOWN since Sep 12th, 2025 at 0.10889542
The short-term trend has been DOWN since Sep 12th, 2025 at 0.10889542
Smart Scan Analysis for TTDGBP
Based on our trend formula, TTDGBP is rated as a -100 on a scale from -100 (Strong Downtrend) to +100 (Strong Uptrend).
| Open | High | Low | Price | Change |
|---|---|---|---|---|
| 0.10852420 | 0.10852420 | 0.10846088 | 0.10847216 | -0.00005200 |
| Prev. Close | Volume | Bid | Ask | Time |
| 0.10852420 | 2025-09-14 21:00:16 |